WORKED EXAMPLE · PAIRED RANKS
Wilcoxon Signed-Rank Worked Example: Paired Symptom Scores
Follow before-and-after ordinal symptom scores through paired changes, zero differences, tied absolute ranks, a signed-rank statistic, and a reproducible BioTabular analysis.
Published by BioTabularLast reviewed: November 2, 2026
These 14 synthetic participants each have a symptom score before and after a program. Scores range from 0 to 10; lower means fewer symptoms. The question is whether the paired scores tend to shift in one direction. This is an illustrative association within people, not evidence that the program caused the change: there is no comparison group or control for other explanations.
Define the design and target
- Observational unit
- One participant with two correctly matched scores.
- Before measurement
- Before-program symptom score, 0–10.
- After measurement
- After-program symptom score, 0–10.
- Difference throughout this example
- After minus before; negative values indicate improvement.
- Calculator order
- Select the after score first and the before score second so BioTabular ranks the same after-minus-before differences.
- Starting method
- Two-sided Wilcoxon signed-rank test with a continuity-corrected normal approximation because zero differences and ties are present.
BioTabular lets users choose either column order. The selected order determines the sign of the differences and the reported positive-rank sum; the two-sided p-value is the same when that order is reversed. The participant ID identifies the matched pair; rows must not be sorted independently by score.
Inspect the synthetic paired data
| Participant | Before | After | After − before |
|---|---|---|---|
| P01 | 8 | 3 | -5 |
| P02 | 9 | 4 | -5 |
| P03 | 7 | 3 | -4 |
| P04 | 8 | 4 | -4 |
| P05 | 9 | 6 | -3 |
| P06 | 7 | 4 | -3 |
| P07 | 8 | 6 | -2 |
| P08 | 6 | 4 | -2 |
| P09 | 7 | 6 | -1 |
| P10 | 6 | 5 | -1 |
| P11 | 5 | 5 | 0 |
| P12 | 8 | 8 | 0 |
| P13 | 6 | 7 | +1 |
| P14 | 7 | 8 | +1 |
Ten participants improve, two are unchanged, and two worsen by one point. The median before score is 7, the median after score is 5, and the median of the 14 individual after-minus-before changes is −2. The difference between the two separate medians is also −2 here by coincidence; paired analysis uses each participant’s actual change.
Plot the pairs
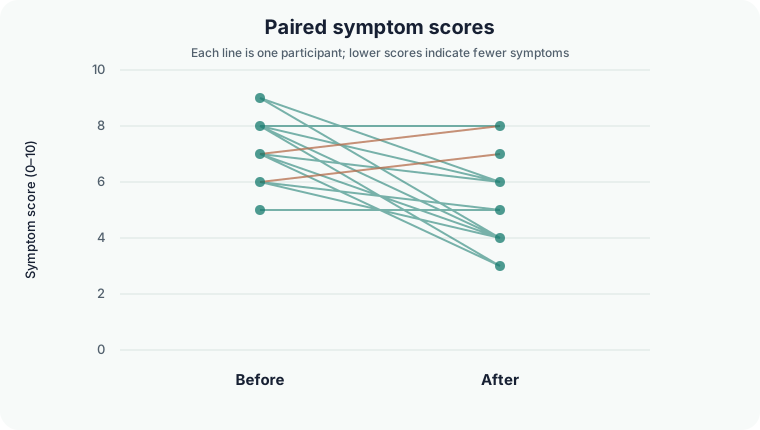
The figure makes the pairing and direction visible before any test is calculated. It also shows many repeated integer values, which create tied change magnitudes. A paired plot and a plot of the differences are useful checks: the signed-rank test is based on the size and sign of each nonzero within-person difference, not on the two unpaired score distributions.
Build the signed ranks
With after selected first, BioTabular calculates after minus before. The nonzero differences are −5, −5, −4, −4, −3, −3, −2, −2, −1, −1, +1, and +1. The two zero differences are set aside before ranking, leaving 12 ranked pairs. Rank the absolute sizes from smallest to largest, giving tied magnitudes their average rank.
| Absolute change | Number of pairs | Occupied ranks | Average rank per pair |
|---|---|---|---|
| 1 | 4 | 1–4 | 2.5 |
| 2 | 2 | 5–6 | 5.5 |
| 3 | 2 | 7–8 | 7.5 |
| 4 | 2 | 9–10 | 9.5 |
| 5 | 2 | 11–12 | 11.5 |
The two positive one-point changes each receive rank 2.5, so the positive-rank sum is V = 5. The negative changes have rank sum 73: the two negative one-point changes contribute 5, and the size-2, 3, 4, and 5 pairs contribute 11, 15, 19, and 23. The two sums total 78, the sum of ranks 1 through 12. Neither a zero change nor a tie creates an extra participant or a degree of freedom.
Read the result
- Complete pairs
- 14; omitted 0
- Zero differences
- 2 excluded from ranks
- Ranked pairs
- 12
- Positive-rank sum for after − before
- V = 5
- Two-sided p-value
- 0.008236
- Computation
- Normal approximation with continuity correction
The null hypothesis concerns a paired difference distribution centered at zero under the signed-rank model. At α = .05, these data provide evidence of a directional shift. The predominance of negative after-minus-before differences points toward improvement. The p-value does not measure the size or clinical value of the change. Because ties and zero differences are present, BioTabular uses a continuity-corrected normal approximation rather than an exact no-ties distribution.
The usual interpretation as a location shift, including a median shift, needs a reasonably symmetric distribution of nonzero paired differences around its center. With this small, discrete dataset, inspect that shape and describe the observed changes directly. BioTabular does not currently report a signed-rank shift estimate or confidence interval; a confirmatory study needing one should use a validated interval procedure.
Reproduce the analysis in BioTabular
- Download the CSV and open the Wilcoxon signed-rank calculator.
- Import it with
Participant_IDas the identifier. Keep the two score columns numeric or ordinal, then confirm the column types. - Select “Two paired columns.” Choose
After_Symptom_Scoreas the first measurement andBefore_Symptom_Scoreas the second, matching the after-minus-before differences in the table. - Keep the two-sided alternative and α = .05, then run the test.
- Check 14 complete pairs, two zeros excluded from ranks, V = 5, and p = .008236. Inspect the paired figure in Plot Studio as well as the numerical output.
Interpret and report with care
“Among 14 participants with paired 0–10 symptom scores, ten had lower scores after the program, two were unchanged, and two had one-point increases. The median paired after-minus-before change was −2 points. A two-sided Wilcoxon signed-rank test of after-minus-before differences, excluding two zero differences from ranks and using a continuity-corrected normal approximation for ties, gave V = 5, p = .0082.”
Describe when the measurements were taken, how the scale was defined, and whether other treatments or changes could explain the observed pattern. Report missing pairs if any. The result supports a within-participant association in this sample; causal claims require a design that addresses secular changes, regression to the mean, and other concurrent influences.
Common mistakes and limits
- Analyzing before and after scores as independent groups and losing the participant matching.
- Sorting each column separately or pairing records without checking IDs.
- Including zero changes in the ranked sample size or assigning arbitrary ranks to ties.
- Calling the statistic a mean difference or treating its p-value as the magnitude of improvement.
- Automatically interpreting a signed-rank result as a median change without considering the shape of paired differences.
- Assuming a significant before-and-after change establishes a program effect without a comparison design.
This synthetic example is complete, small, and intentionally simple. Real data may have missing visits, floor effects, clustering, unequal follow-up intervals, and asymmetric changes. In those settings, consider a method matched to the scientific estimand and design, and seek statistical support for confirmatory inference.
Related resources
Compare this rank-based paired analysis with the paired t-test worked example, which estimates a mean within-person difference. Review Paired vs. Independent Samples for the design distinction, and Kruskal–Wallis and Dunn for ranks across three independent groups.
References and further reading
- R documentation: Wilcoxon rank-sum and signed-rank tests
- NIST e-Handbook: Paired comparison methods
- NIST/SEMATECH e-Handbook of Statistical Methods
- American Statistical Association statement on statistical significance and p-values
BioTabular’s editorial approach and scope explain how these educational resources are prepared and what they do not replace.