WORKED EXAMPLE · COMPARING THREE GROUPS
One-Way ANOVA Worked Example: Three Independent Groups
Follow a synthetic dose-group study from independent observations and assumption checks through the overall one-way ANOVA, Tukey-adjusted comparisons, interpretation, and reporting.
Published by BioTabularLast reviewed: October 27, 2026
This worked example uses synthetic data created for teaching. Suppose a laboratory experiment asks whether mean enzyme activity differs among three independently assigned dose groups. Each biological sample is assigned to exactly one group and measured once. The outcome is numeric, the grouping factor has three levels, and the estimand is the pattern of population means.
Define the study before choosing the test
- Observational unit
- One independently assigned biological sample.
- Group structure
- Control, low dose, or high dose; every sample belongs to one group only.
- Outcome
- Enzyme activity in units per litre (U/L).
- Primary question
- Do the three population mean enzyme activities all equal one another?
- Follow-up question
- Which prespecified group pairs differ after controlling family-wise error?
- Starting method
- Classical one-way ANOVA followed by Tukey HSD when independence, within-group shape, and equal-variance assumptions are reasonable.
The null hypothesis is that all three population means are equal. The alternative is that at least one differs. The overall ANOVA does not say that every group differs, and it does not identify a particular contrast by itself.
Inspect the synthetic data
There are ten complete observations in each group and no missing values. Keeping the data in long format makes the observational unit explicit: one row is one sample, with a categorical dose column and one numeric outcome column.
| Sample | Dose group | Enzyme activity (U/L) |
|---|---|---|
| C01 | Control | 10.2 |
| C02 | Control | 11.1 |
| C03 | Control | 9.8 |
| C04 | Control | 10.7 |
| C05 | Control | 11.4 |
| C06 | Control | 10.5 |
| C07 | Control | 9.9 |
| C08 | Control | 10.8 |
| C09 | Control | 11.0 |
| C10 | Control | 10.1 |
| L01 | Low dose | 11.0 |
| L02 | Low dose | 11.8 |
| L03 | Low dose | 10.9 |
| L04 | Low dose | 12.1 |
| L05 | Low dose | 11.5 |
| L06 | Low dose | 12.0 |
| L07 | Low dose | 11.2 |
| L08 | Low dose | 11.7 |
| L09 | Low dose | 12.3 |
| L10 | Low dose | 11.4 |
| H01 | High dose | 13.4 |
| H02 | High dose | 14.1 |
| H03 | High dose | 13.8 |
| H04 | High dose | 14.5 |
| H05 | High dose | 13.1 |
| H06 | High dose | 14.0 |
| H07 | High dose | 14.7 |
| H08 | High dose | 13.6 |
| H09 | High dose | 14.3 |
| H10 | High dose | 13.9 |
Describe the groups before testing
- Control
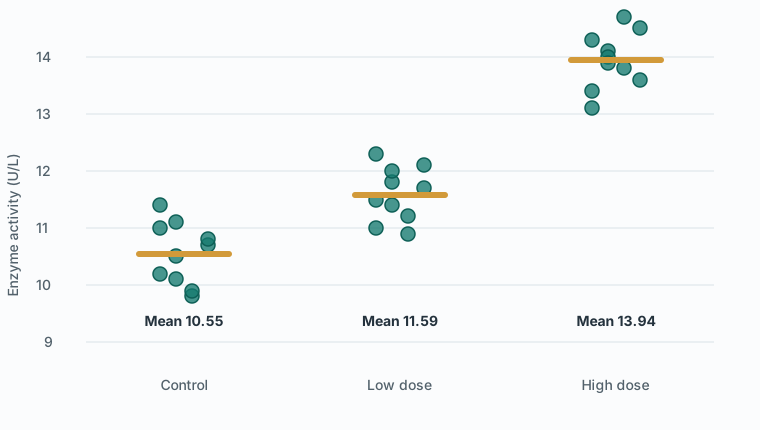
- n = 10; mean = 10.550 U/L; SD = 0.540
- Low dose
- n = 10; mean = 11.590 U/L; SD = 0.472
- High dose
- n = 10; mean = 13.940 U/L; SD = 0.493
- Grand mean
- 12.0267 U/L across 30 samples
- Variance ratio
- 1.31, highest sample variance divided by lowest
- Complete observations
- 30; omitted 0
Calculate the overall ANOVA
ANOVA partitions total variation into variation between the three group means and variation among observations within their groups. Dividing each sum of squares by its degrees of freedom gives a mean square. Their ratio is the F statistic.
| Source | SS | df | MS | F | p |
|---|---|---|---|---|---|
| Between groups | 60.321 | 2 | 30.160 | 119.438 | < .001 |
| Within groups | 6.818 | 27 | 0.253 | — | — |
| Total | 67.139 | 29 | — | — | — |
F = MSbetween ÷ MSwithin = 30.1603 ÷ 0.2525F(2, 27) = 119.4381; p < .001
The overall result provides evidence against equality of all three population means. The descriptive eta-squared value is 60.321 ÷ 67.139 = 0.898, meaning that about 89.8% of the observed outcome variation in this deliberately clear synthetic dataset lies between dose groups. This proportion is not automatically a causal effect or an unbiased population estimate.
Use adjusted follow-up comparisons
Because the overall test does not locate the differences, BioTabular reports Tukey HSD comparisons with 95% family-wise confidence intervals. The subtraction direction is the second named group minus the first.
| Contrast | Mean difference (U/L) | 95% family-wise CI | Adjusted p |
|---|---|---|---|
| Low dose − Control | 1.040 | 0.483 to 1.597 | < .001 |
| High dose − Control | 3.390 | 2.833 to 3.947 | < .001 |
| High dose − Low dose | 2.350 | 1.793 to 2.907 | < .001 |
Assumptions and practical checks
- Independent observations: no sample appears in more than one group, and there is no unmodeled batch, litter, site, plate, or participant clustering.
- Numeric outcome: enzyme activity is measured on a scale for which means and differences are meaningful.
- Within-group shape: inspect observations or residuals for severe skewness, unusual points, or data errors. A non-significant normality test does not prove a model correct.
- Comparable variances: the group SDs are similar here. Important heterogeneity, especially with unequal group sizes, may favor Welch ANOVA or another suitable method.
- Planned comparisons: choose contrasts and multiplicity control from the scientific questions, not after scanning the results.
If samples are repeatedly measured, matched, nested, or clustered, ordinary one-way ANOVA is not made appropriate by a visually balanced plot. The dependence structure must be represented in the analysis.
Reproduce the result in BioTabular
- Download the synthetic CSV and open the one-way ANOVA calculator.
- Import the file. Keep
Sample_IDas the identifier,Dose_Groupas categorical, andEnzyme_Activity_U_Las numeric. - Review the dose order as Control, Low dose, High dose, then confirm the variable roles.
- Use outcome-plus-grouping-column format. Select
Enzyme_Activity_U_Las the outcome andDose_Groupas the grouping column. - Run ANOVA with Tukey HSD. Confirm 30 complete rows; group means 10.550, 11.590, and 13.940; F(2, 27) = 119.438; and p < .001.
- Read the Tukey table using its stated subtraction direction, adjusted p-values, and family-wise intervals.
- Use the Plot Studio handoff to inspect a box plot or violin plot with the observations retained.
Interpret and report the result
At α = .05, the data provide evidence that at least one population mean differs. The Tukey comparisons support higher mean enzyme activity in low dose than control, in high dose than control, and in high dose than low dose for this synthetic study. The analysis does not by itself establish a dose-response mechanism, biological importance, generalizability, or freedom from bias.
“Mean enzyme activity was 10.55 U/L (SD 0.54) in control, 11.59 U/L (SD 0.47) in low dose, and 13.94 U/L (SD 0.49) in high dose. A one-way ANOVA indicated that mean activity differed among groups, F(2, 27) = 119.44, p < .001, η² = .898. Tukey-adjusted comparisons estimated differences of 1.04 U/L for low dose versus control (95% family-wise CI 0.48 to 1.60), 3.39 U/L for high dose versus control (2.83 to 3.95), and 2.35 U/L for high versus low dose (1.79 to 2.91); all adjusted p values were < .001.”
Common mistakes this example avoids
- Running three ordinary t-tests without controlling the family-wise error rate.
- Claiming every pair differs from the overall ANOVA alone.
- Ignoring the sign and order of a reported contrast.
- Using a bar chart that hides the individual observations and group spread.
- Calling repeated or clustered samples independent.
- Choosing ANOVA because each group separately “passed” a normality test.
Limits of this worked example
The groups are balanced, complete, independent, and deliberately well separated. Real experiments may include batch effects, unequal variances, missing outcomes, planned covariates, repeated measurements, unequal allocation, or scientifically targeted contrasts. BioTabular currently reports the classical equal-variance one-way ANOVA; if heterogeneity is material, use a validated Welch ANOVA implementation or another prespecified approach.
Related resources
Read T-test vs. ANOVA for the broader method choice. Compare this multi-group design with the independent two-group worked example, or return to Which Statistical Test Should I Use? for other data structures.
References and further reading
- R documentation: Fit an Analysis of Variance Model
- R documentation: Tukey multiple comparisons of means
- NIST/SEMATECH e-Handbook of Statistical Methods
- American Statistical Association statement on statistical significance and p-values
BioTabular’s editorial approach and scope explain how these educational resources are prepared and what they do not replace.