WORKED EXAMPLE
Independent T-Test Worked Example: Treatment vs. Control
Follow a Welch independent two-sample t-test from a parallel-group treatment-and-control dataset through the design, group summaries, assumptions, calculation, confidence interval, BioTabular setup, interpretation, and reporting language.
Published by BioTabularPublished and reviewed: October 25, 2026
This complete teaching pathway uses synthetic values. It is not clinical evidence and does not claim that a real treatment changes this biomarker.
Research question and study design
Suppose a randomized parallel-group study measures a continuous inflammatory biomarker 14 days after assigning each of 26 participants to either treatment or control. Each participant contributes one outcome value. The research question is: What is the population mean difference in the day-14 biomarker between the treatment and control groups?
- Observational unit
- The participant.
- Group structure
- Different participants belong to treatment and control; there is no pairing key.
- Outcome
- Day-14 biomarker concentration in ng/mL.
- Estimand
- The population mean difference between treatment and control.
- Subtraction direction
- Treatment minus control. Negative differences represent a lower treatment mean.
- Starting method
- A two-sided Welch independent t-test when a mean difference is meaningful and the assumptions are reasonable.
The synthetic treatment-and-control dataset
Every row is one participant. The groups need not contain the same number of observations: this dataset has 14 control participants and 12 treatment participants, with no missing outcomes.
| Participant | Group | Day-14 biomarker (ng/mL) |
|---|---|---|
| C01 | Control | 18.2 |
| C02 | Control | 19.5 |
| C03 | Control | 17.1 |
| C04 | Control | 20.3 |
| C05 | Control | 16.8 |
| C06 | Control | 21.0 |
| C07 | Control | 18.7 |
| C08 | Control | 19.1 |
| C09 | Control | 17.6 |
| C10 | Control | 20.8 |
| C11 | Control | 18.0 |
| C12 | Control | 19.9 |
| C13 | Control | 17.4 |
| C14 | Control | 20.1 |
| T01 | Treatment | 13.2 |
| T02 | Treatment | 15.8 |
| T03 | Treatment | 11.9 |
| T04 | Treatment | 17.1 |
| T05 | Treatment | 14.4 |
| T06 | Treatment | 9.8 |
| T07 | Treatment | 18.3 |
| T08 | Treatment | 12.7 |
| T09 | Treatment | 16.0 |
| T10 | Treatment | 10.9 |
| T11 | Treatment | 15.1 |
| T12 | Treatment | 13.8 |
Privacy note: this downloadable file is synthetic. When it is imported into the Workspace, BioTabular processes it in browser memory during the active page session rather than uploading the rows to BioTabular.
Why the groups are independent
Participant T01 is not the follow-up or matched counterpart of C01. The identifiers distinguish records, but they do not create pairs. Each participant appears once and belongs to only one group, so the analysis compares two independent samples.
Pairing the rows by their displayed order would invent information that is absent from the design, discard two control observations, and answer the wrong question. Equal group sizes are not required for an independent comparison.
Why use Welch’s t-test?
Welch’s independent two-sample t-test estimates a difference between two population means without imposing an equal-variance model. It is a sensible default here because the sample sizes differ and the treatment observations are more variable. The scientific target remains a treatment-minus-control difference in means.
This choice should follow the design and estimand rather than treating a preliminary variance test as an automatic gatekeeper. A Wilcoxon rank-sum test is not simply a variance-free version of the same mean comparison: it uses ranks and its interpretation differs.
Calculate the Welch independent t-test
- Control
- n = 14; mean 18.8929; SD 1.4074 ng/mL
- Treatment
- n = 12; mean 14.0833; SD 2.5344 ng/mL
- Mean difference
- −4.8095 ng/mL
- Standard error
- 0.8227 ng/mL
- Welch degrees of freedom
- 16.602
- Complete observations
- 26; omitted 0
t = (treatment mean − control mean) ÷ standard error−4.8095 ÷ 0.8227 = −5.8464
The two-sided p-value is 0.00002138. The 95% confidence interval for treatment minus control is −6.5483 to −3.0707 ng/mL.
Inspect both group distributions
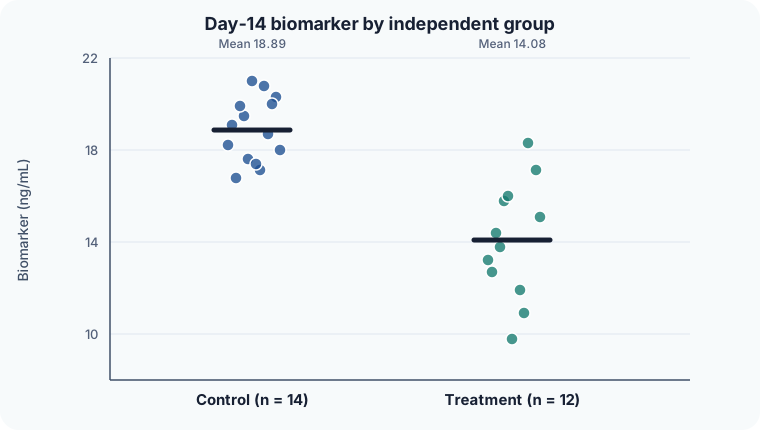
The plot shows the observations that the two means summarize. It also makes clear why connecting treatment and control dots would be inappropriate: there is no participant-level link between the groups.
Assumptions and practical checks
- Independent observations: each participant should contribute one outcome, and one participant’s value should not determine another’s.
- Correct groups: verify treatment assignment and confirm that no participant appears in both groups.
- Numeric outcome and meaningful mean: the measurement scale must support a mean-difference interpretation.
- Group distributions: inspect each group for data errors, severe skewness, or influential observations, especially with small samples.
- Analysis context: state the assignment mechanism, missing-data handling, and whether the comparison was prespecified.
Welch’s test does not require equal group variances. It still relies on independent observations and on a mean-based sampling model that is reasonable for the design and observed data. Do not remove an unusual observation merely because it changes the p-value.
Reproduce the result in BioTabular
- Download the synthetic CSV and open the BioTabular t-test calculator.
- Import the file. Keep
Participant_IDas the identifier,Groupas categorical, andDay14_Biomarker_ng_mLas numeric. - Before confirming roles, move Treatment above Control in the category order. BioTabular reports the first group minus the second group.
- Choose Independent two-sample t-test (Welch) and use the grouping-column format.
- Set the outcome to
Day14_Biomarker_ng_mLand the grouping column toGroup. - Keep the two-sided alternative and 0.05 significance level, then run the analysis.
- Confirm group sizes of 12 and 14, zero omitted observations, and the Welch result. Use the grouped box-plot or violin-plot handoff to inspect individual observations.
Interpret the result
The estimated treatment-minus-control mean difference is −4.81 ng/mL. Under the Welch model, the synthetic data are compatible with a treatment mean roughly 3.07 to 6.55 ng/mL lower than the control mean.
The interval quantifies uncertainty around the population mean difference; it is not a range containing 95% of individual observations. The small p-value measures incompatibility with a zero mean difference under the model. It does not by itself establish practical importance, absence of bias, or generalizability.
Because this hypothetical design specifies random assignment, the contrast is framed as a treatment comparison. A real causal interpretation would additionally depend on adherence, missing outcomes, protocol deviations, measurement quality, and the validity of the study’s conduct.
Reporting example
“The day-14 biomarker was lower in the treatment group (mean 14.08 ng/mL, SD 2.53, n = 12) than in the control group (mean 18.89 ng/mL, SD 1.41, n = 14). The estimated mean difference (treatment minus control) was −4.81 ng/mL (95% CI −6.55 to −3.07; Welch t(16.60) = −5.85; two-sided p < .001).”
A complete report should also describe randomization, eligibility, outcome measurement, missing-data handling, protocol deviations, and whether this comparison was prespecified.
Common mistakes this example avoids
- Pairing treatment and control participants by row order.
- Assuming equal group sizes are required.
- Reversing the group order while retaining an interpretation written for treatment minus control.
- Choosing a pooled-variance test automatically or using a variance pretest as the sole decision rule.
- Reporting only p < .001 without group summaries, the mean difference, and its confidence interval.
- Interpreting statistical significance as proof of practical importance or flawless causal identification.
Limits of this worked example
This illustration has one outcome time point, no missing observations, no covariate adjustment, and no clustering. A real study may need baseline adjustment, repeated-measures or mixed models, cluster-aware methods, robust or transformed models, or a prespecified missing-data analysis. Multiple outcomes or comparisons also require an appropriate multiplicity plan.
Related resources
Compare this independent design with the paired before-and-after worked example. Return to Paired vs. Independent Samples for the broader study-design decision, or read T-test vs. ANOVA for the relationship between two-group and multi-group mean comparisons.
References and further reading
- NIST/SEMATECH: Two-sample t-test for equal means
- Statistical notes for clinical researchers: the independent samples t-test
- Statistics review 5: Comparison of means
- NIST/SEMATECH e-Handbook of Statistical Methods
- American Statistical Association statement on statistical significance and p-values
BioTabular’s editorial approach and scope explain how these educational resources are prepared and what they do not replace.