STATISTICAL FOUNDATIONS
What Is a Normal Distribution? A Practical Guide for Research Data
A normal distribution is a symmetric, bell-shaped pattern of values. It is a useful statistical model, but real research data do not need to form a perfect bell curve before they can be analyzed well.
Published by BioTabularLast reviewed: August 24, 2026
The useful question is not “Is my data perfectly normal?” It is whether a normal model, or a method that uses one, is a reasonable way to answer the research question for the data and study design at hand.
The short answer
| Question | Practical answer |
|---|---|
| What does “normally distributed” mean? | The values follow a symmetric bell-shaped pattern around a central mean. |
| Does every dataset need to be normal? | No. Many important variables are skewed, bounded, categorical, or counts. |
| Do all values need to sit exactly on a bell curve? | No. Real samples vary by chance; look for meaningful departures, not perfection. |
What the bell curve describes
In a normal distribution, the mean, median, and mode are all at the center. The two sides mirror each other: values equally far above and below the mean are similarly common. The spread is described by the standard deviation.
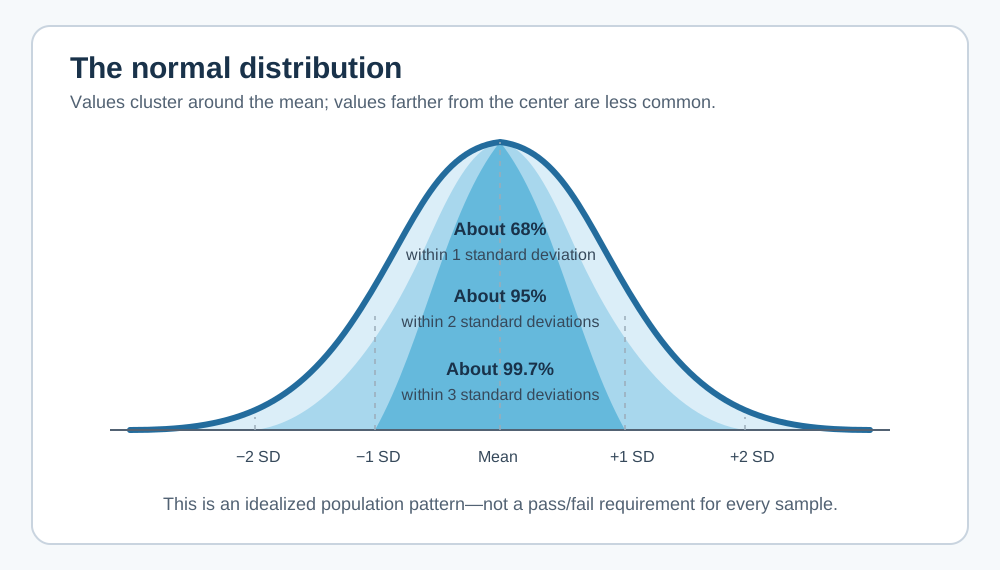
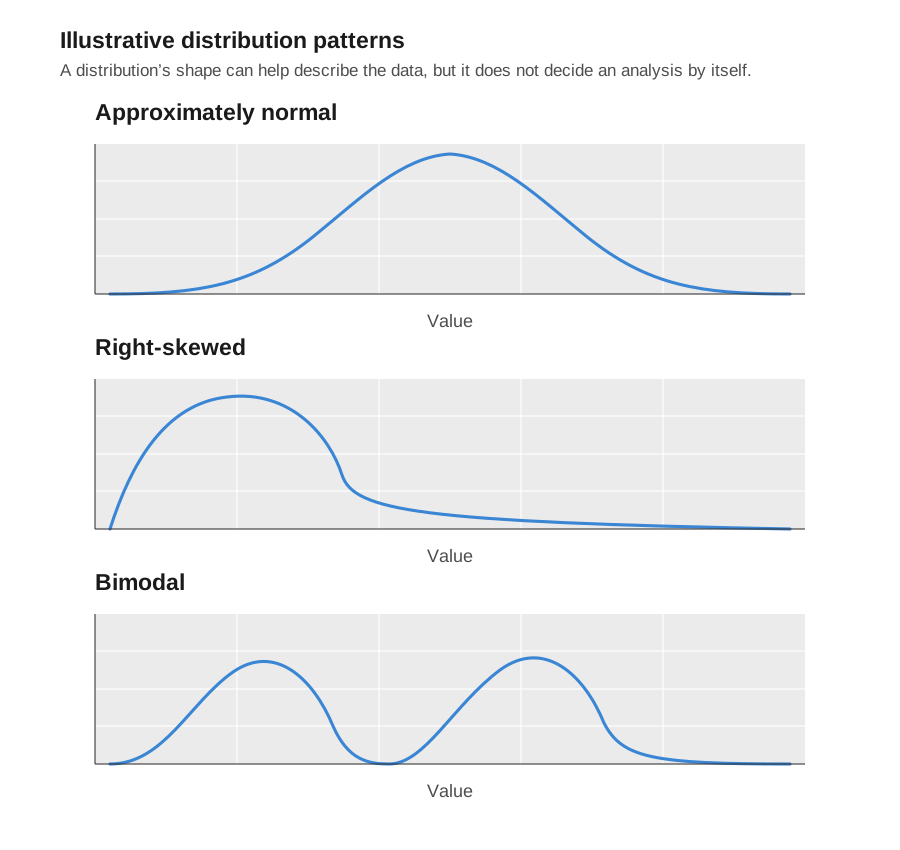
These percentages describe a model for a population, not a rule that every small sample must match exactly. Adult height in a relatively homogeneous population can often look approximately bell-shaped. Hospital length of stay commonly has a long right tail: most stays are short while a smaller number are much longer. Both patterns can be real and informative.
Why normality matters in statistical analysis
Some commonly used methods describe differences in means and estimate uncertainty using a normal model. Examples include t-tests, analysis of variance (ANOVA), and many linear regression models.
The relevant assumption is often more specific than “the raw data are normal.” For a two-sample t-test or one-way ANOVA, consider the outcome distributions within groups. For linear regression, the focus is commonly on the residuals: the differences between observed outcomes and the values predicted by the model.
Normality is only one consideration. Independence of observations, measurement scale, outliers, group sizes, unequal variability, and study design may matter just as much—or more. Repeated measurements from the same person are not made independent simply because a histogram looks bell-shaped.
Sample data and the sampling distribution
Three related ideas are easy to confuse:
- The population distribution describes how a variable is distributed in the larger population of interest.
- The sample distribution is the pattern in the data actually collected. It can look uneven even when the population is approximately normal, particularly in a small sample.
- The sampling distribution of a statistic describes how a statistic, such as a sample mean, would vary across many comparable samples.
This helps explain why mean-based methods can often perform reasonably well with larger samples even when individual observations are not perfectly normal. It is not permission to ignore severe skewness, influential outliers, very small groups, or a design that does not fit the method.
How to look at your data
Start with a plot and a summary, preferably before choosing an analysis solely from a test result.
Histogram, dot plot, and box plot
A histogram shows the spread across intervals; look for strong skewness, unusually long tails, gaps, or more than one cluster. A dot plot is often clearest for small samples because it shows every observation. A box plot is useful for comparing groups, but pair it with individual observations when feasible.
Q–Q plot
A quantile–quantile (Q–Q) plot compares observed values with those expected under a normal distribution. If points mostly follow a straight line, the distribution is reasonably compatible with a normal model. Systematic curvature can indicate skewness or different tail behavior; an isolated point can indicate a potential outlier.
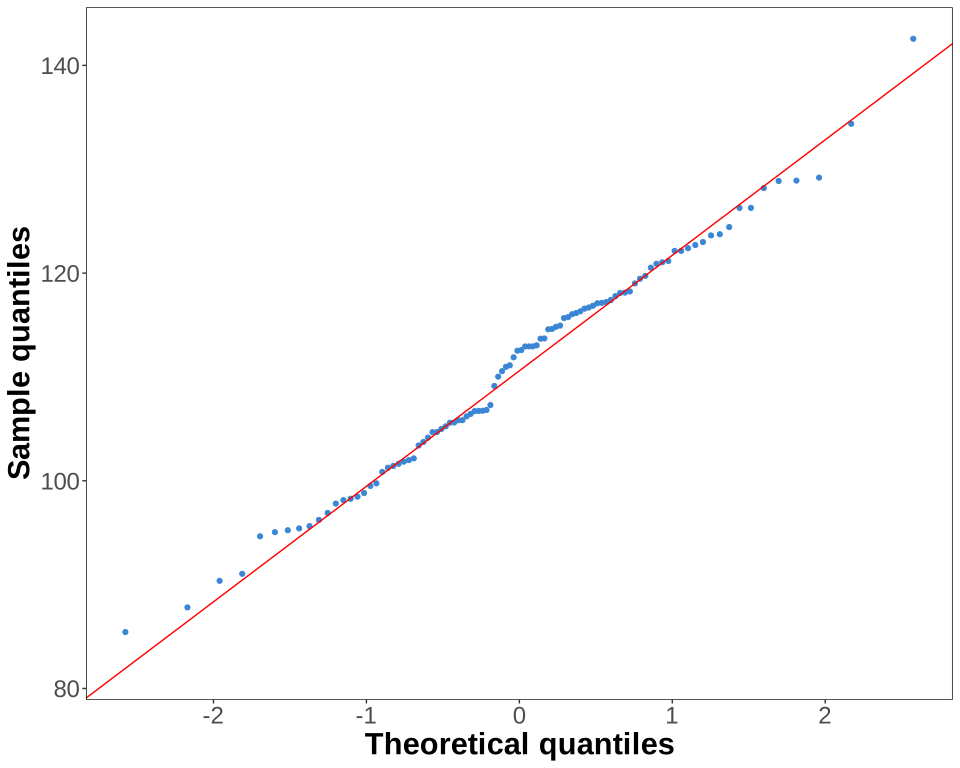
No plot is a pass/fail certification. The aim is to understand the data and whether any departure could materially affect the planned estimate or conclusion.
Check the right distribution
When comparing groups, do not pool all observations into one histogram and call the question settled. Combining groups with different means can create a wide or even two-peaked distribution even if each group is individually well behaved. A two-sample comparison should inspect the outcome by group.
A paired analysis focuses on the within-pair differences, not necessarily the two original measurement columns separately. For a regression model, inspect residuals in relation to fitted values and important predictors, not only the overall outcome histogram.
What about a normality test?
Formal tests such as the Shapiro–Wilk test compare the data with a normal-distribution model. They can be useful diagnostic information, but the p-value should not make the decision by itself.
With a very small sample, a normality test may have little ability to detect an important departure. With a very large sample, it may flag a tiny departure that has no practical effect on a robust analysis. Use the test alongside plots and knowledge of the measurement process.
When a normal model may not fit
- Counts: numbers of events, colonies, or visits are nonnegative whole numbers and may have many zeros.
- Binary outcomes: yes/no outcomes need a categorical-data method rather than a normal model.
- Proportions: values restricted between 0 and 1 can pile up near the boundaries.
- Strongly right-skewed measurements: concentrations, costs, and times to an event may have a long upper tail.
- Ordinal ratings: ordered categories, such as pain ratings, are not automatically continuous normal measurements.
- Multiple subpopulations: a mixture of clearly different groups can produce more than one peak; the grouping may need to be modeled rather than ignored.
Possible responses include using a method designed for the outcome type, modeling a justified transformed scale, using a robust or rank-based approach, or fitting a regression model suited to the distribution. The choice should follow the estimand—the quantity the study is trying to estimate—not an automatic “normal versus non-normal” rule.
Common mistakes
“A bell-shaped histogram proves the analysis is valid.”
No. A symmetric outcome does not establish independence, correct grouping, equal variability, appropriate handling of missing data, or a causal interpretation.
“Any skewness means I must use a nonparametric test.”
Not necessarily. Mild skewness may have little practical effect on a suitable mean-based analysis, especially with adequate group sizes and no influential outliers. A rank-based test answers a different question from a mean comparison, so select it for its scientific interpretation, not merely as an automatic backup.
“I should delete outliers to make the data normal.”
No. First check for recording or measurement errors using a documented process. A real extreme value may be scientifically important. Do not remove observations simply because they change a p-value.
“Normality means the result is clinically important.”
No. Distributional shape says nothing by itself about the size, relevance, or causality of an observed effect. Report the estimate and its uncertainty in the context of the study.
A practical workflow
- Define the outcome, research question, and what one observation represents.
- Check whether observations are independent or whether there are pairs, clusters, or repeated measurements.
- Plot the outcome in the relevant groups, or inspect model residuals when using regression.
- Look for data errors, strong skewness, multiple clusters, and influential outliers.
- Consider sample size, group balance, variation, and whether a mean is a meaningful summary.
- Choose an analysis that matches the outcome type and study design; use a normality test only as one piece of evidence.
- Report data summaries, the estimate, its confidence interval, and relevant assumptions or diagnostics.
Related resources
For choosing a common analysis from the study question and data structure, see Which Statistical Test Should I Use?. For a mean-comparison decision, see T-test vs. ANOVA: How to Choose for Comparing Group Means. For how p-values, thresholds, and confidence intervals fit into an analysis, see How Hypothesis Testing Works: A Practical Guide for Research.
References and further reading
- NIST/SEMATECH e-Handbook of Statistical Methods
- American Statistical Association statement on statistical significance and p-values
BioTabular’s editorial approach and scope explain how these educational resources are prepared and what they do not replace.